Visualize Schedules, Dependencies, and Progress with Clarity
FusionCharts Gantt is a powerful, timeline visualization solution for building interactive project schedules, operational timelines and workflow views inside modern applications. Designed for data-heavy and enterprise environments, it enables teams to clearly communicate task structure, dependencies, milestones, and progress without the complexity of building custom scheduling components from scratch.
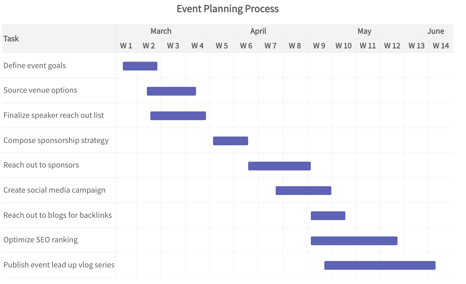
Simple gantt
With progress indicators for each task
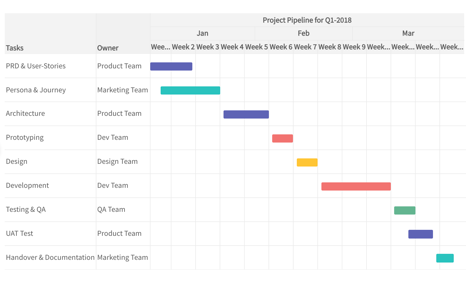
With task owner listed & multi-level dates
Grouped view of tasks
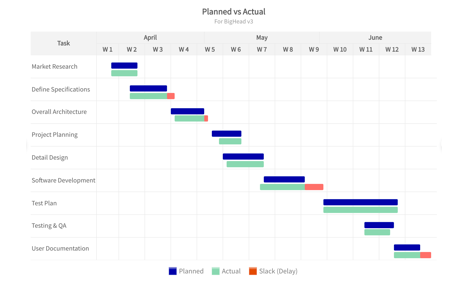
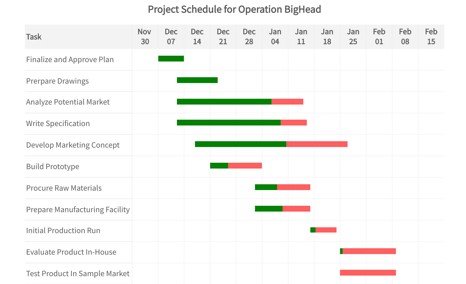
Showing planning vs actuals
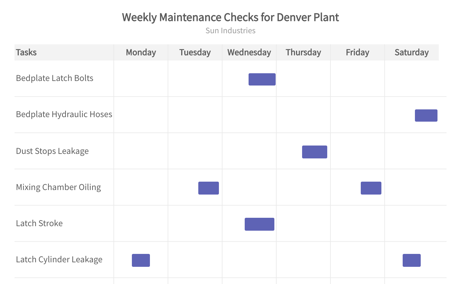
Weekly task distribution
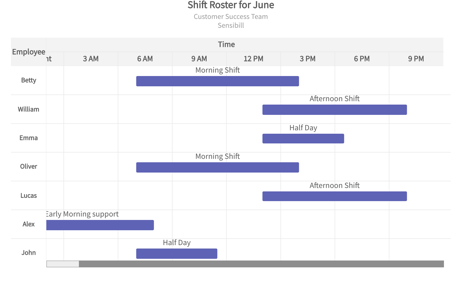
Hourly tasks
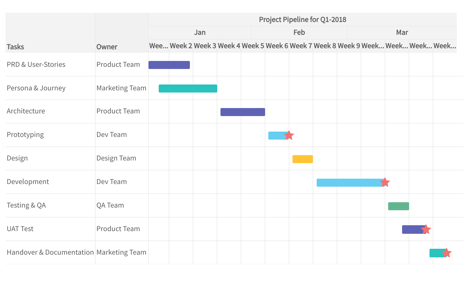
Milestone indicators
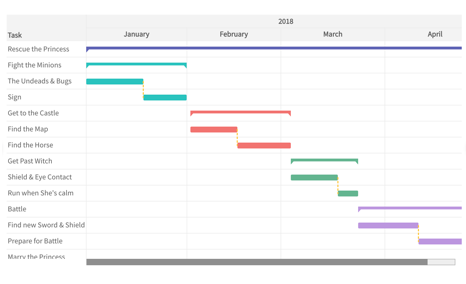
Showing dependent tasks
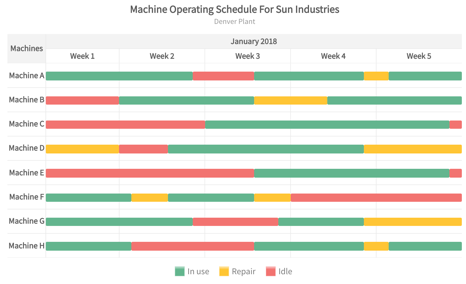
Machine operating schedule
Built for Structured Timeline Visualization
FusionCharts Gantt is designed for applications where time, sequencing, and dependencies are critical. It allows teams to transform complex schedules into interactive visual timelines that make it easy for users to understand what’s planned, what’s in progress, and what’s at risk.
Designed for Developers, Trusted by Enterprises
FusionCharts Maps is built to integrate seamlessly into modern application stacks while meeting enterprise expectations for performance and stability.
- Framework-agnostic implementation
- Combination and multi-series charts
- Optimized rendering for large datasets
- Predictable behavior across browsers and devices
This makes it ideal for SaaS platforms, internal enterprise tools, and data-driven products where timeline visualization is a core feature.
What You Can Build with FusionCharts Gantts
FusionCharts Gantt supports a wide range of business and enterprise scheduling use cases, helping teams move beyond static project charts and spreadsheets.

Project Management
Applications
Visualize tasks, phases, dependencies and milestones across projects to give teams and stakeholders a shared view of delivery timelines.
- Task hierarchies and parent–child relationships
- Dependencies and critical paths
- Milestones and progress indicators

Operational &
Workflow Scheduling
Model operational timelines where tasks are sequential, interdependent, or resource-based.
- Manufacturing and production schedules
- IT deployment and release timelines
- Service delivery and operational planning

Resource & Capacity
Planning
Use Gantt charts to align tasks with available time and capacity across teams or systems.
- Identify bottlenecks and overlaps
- Track utilization over time
- Support data-driven planning decisions

Reporting & Timeline
Communication
Communicate complex schedules clearly to internal teams, customers, or executives.
- Executive timeline overviews
- Status and progress reporting
- Visual explanations of delays or dependencies
Turn numbers into narratives your users actually understand
FusionCharts Gantts is included as part of the FusionCharts charting suite, alongside Maps and Charts visualizations.