Grids: A Premium Extension for Data-Heavy Applications
While FusionCharts, Maps, and Gantt provide powerful visual insight as part of the core FusionCharts license, Grids is designed for teams that need deeper, high-volume data interaction beyond visualization alone.
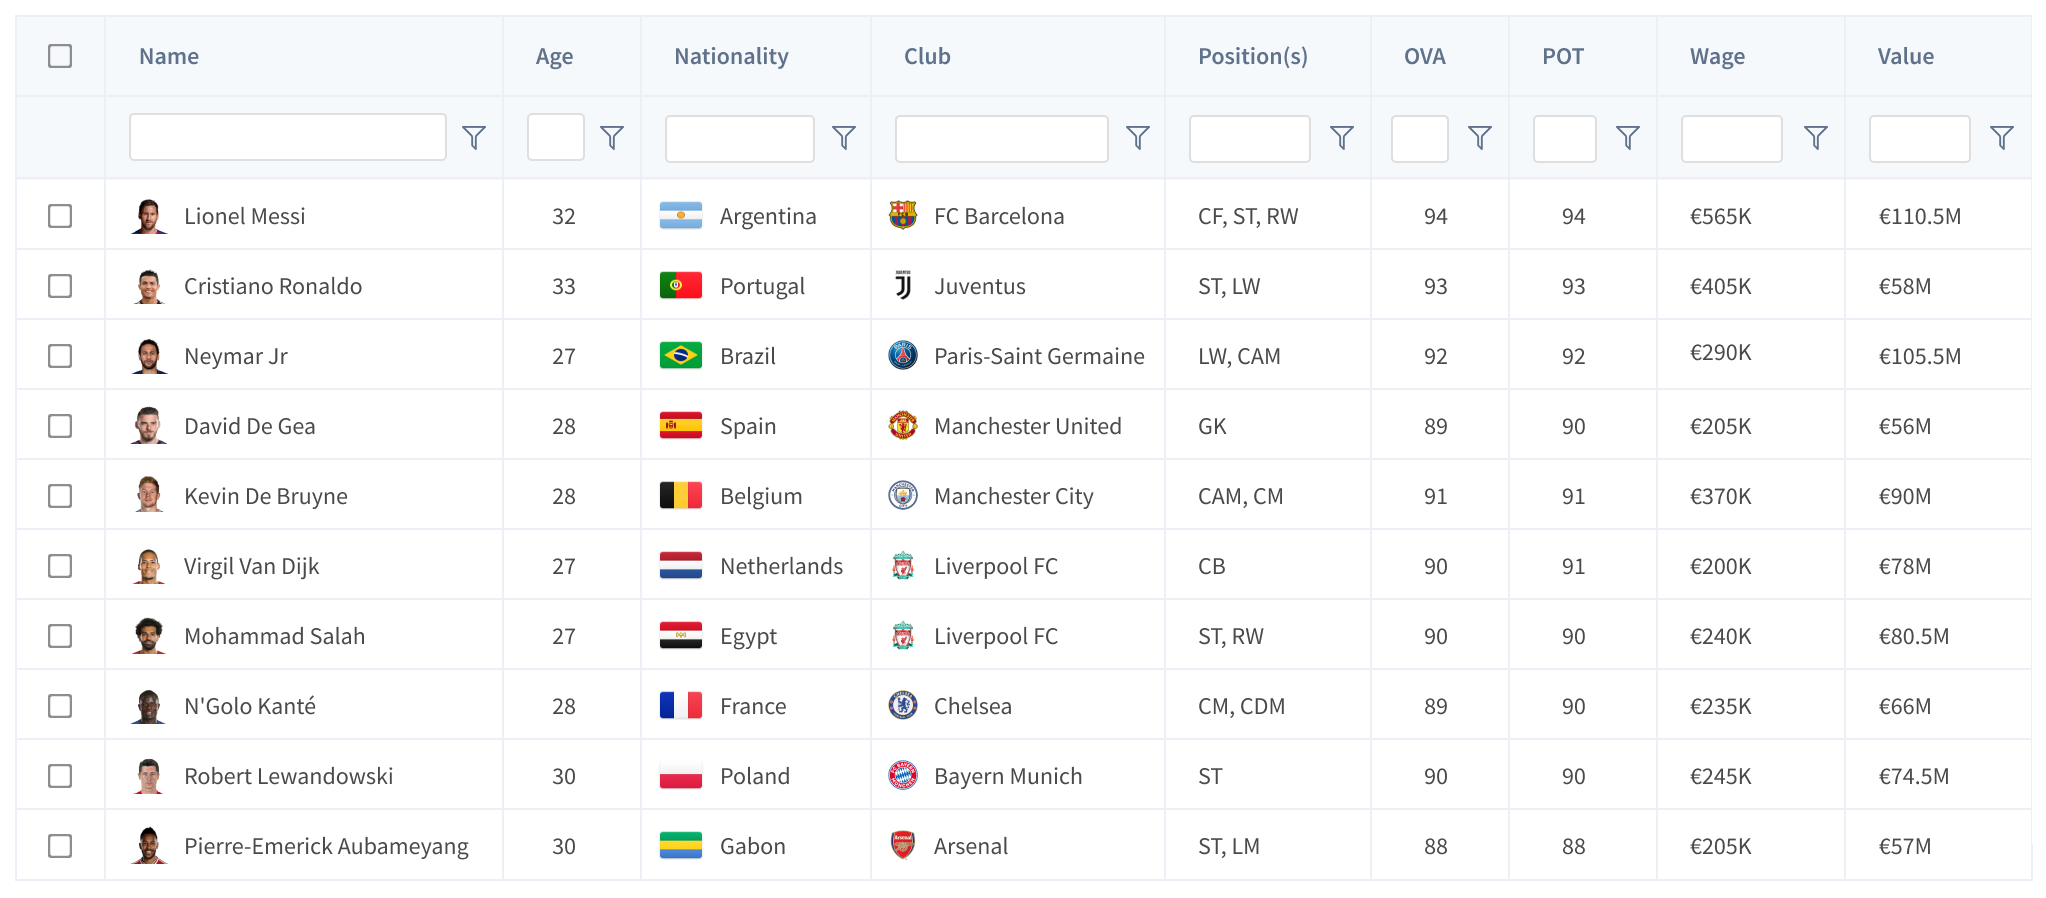
Column Filter in Grid
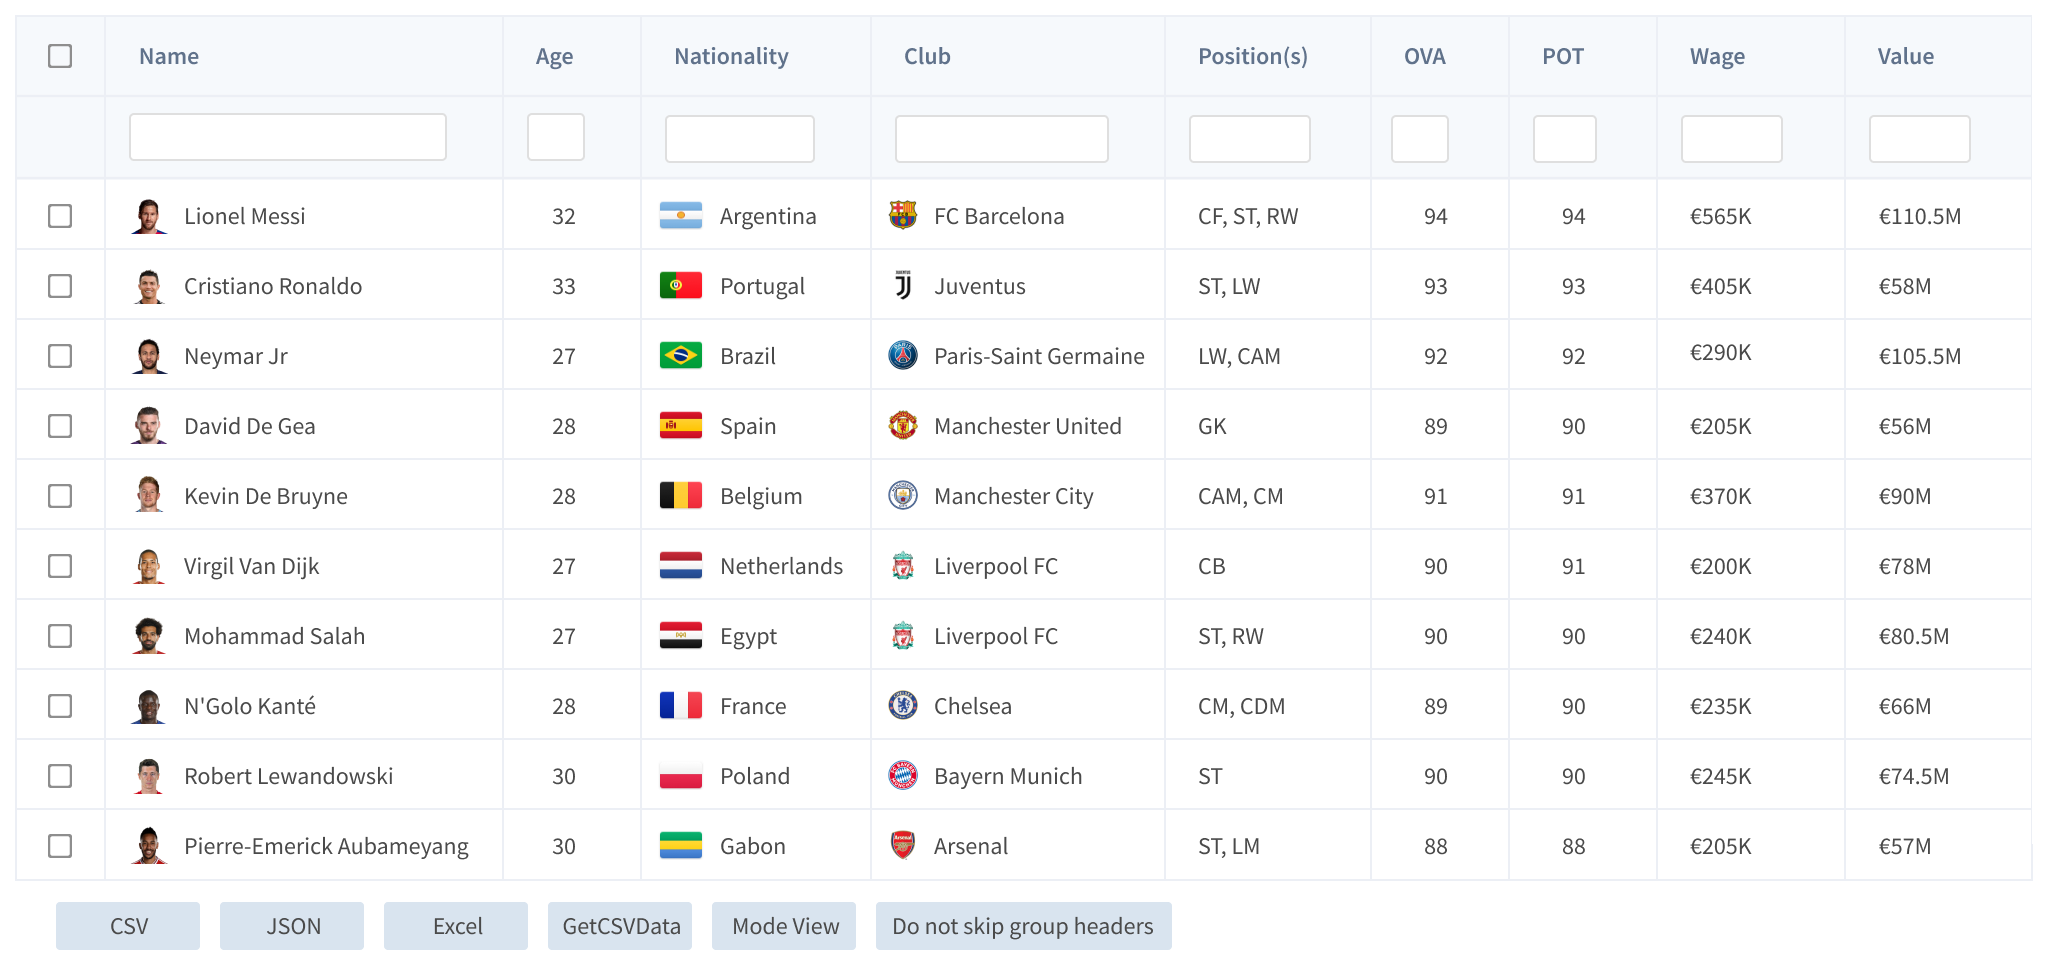
Data Export in Fusion Grid
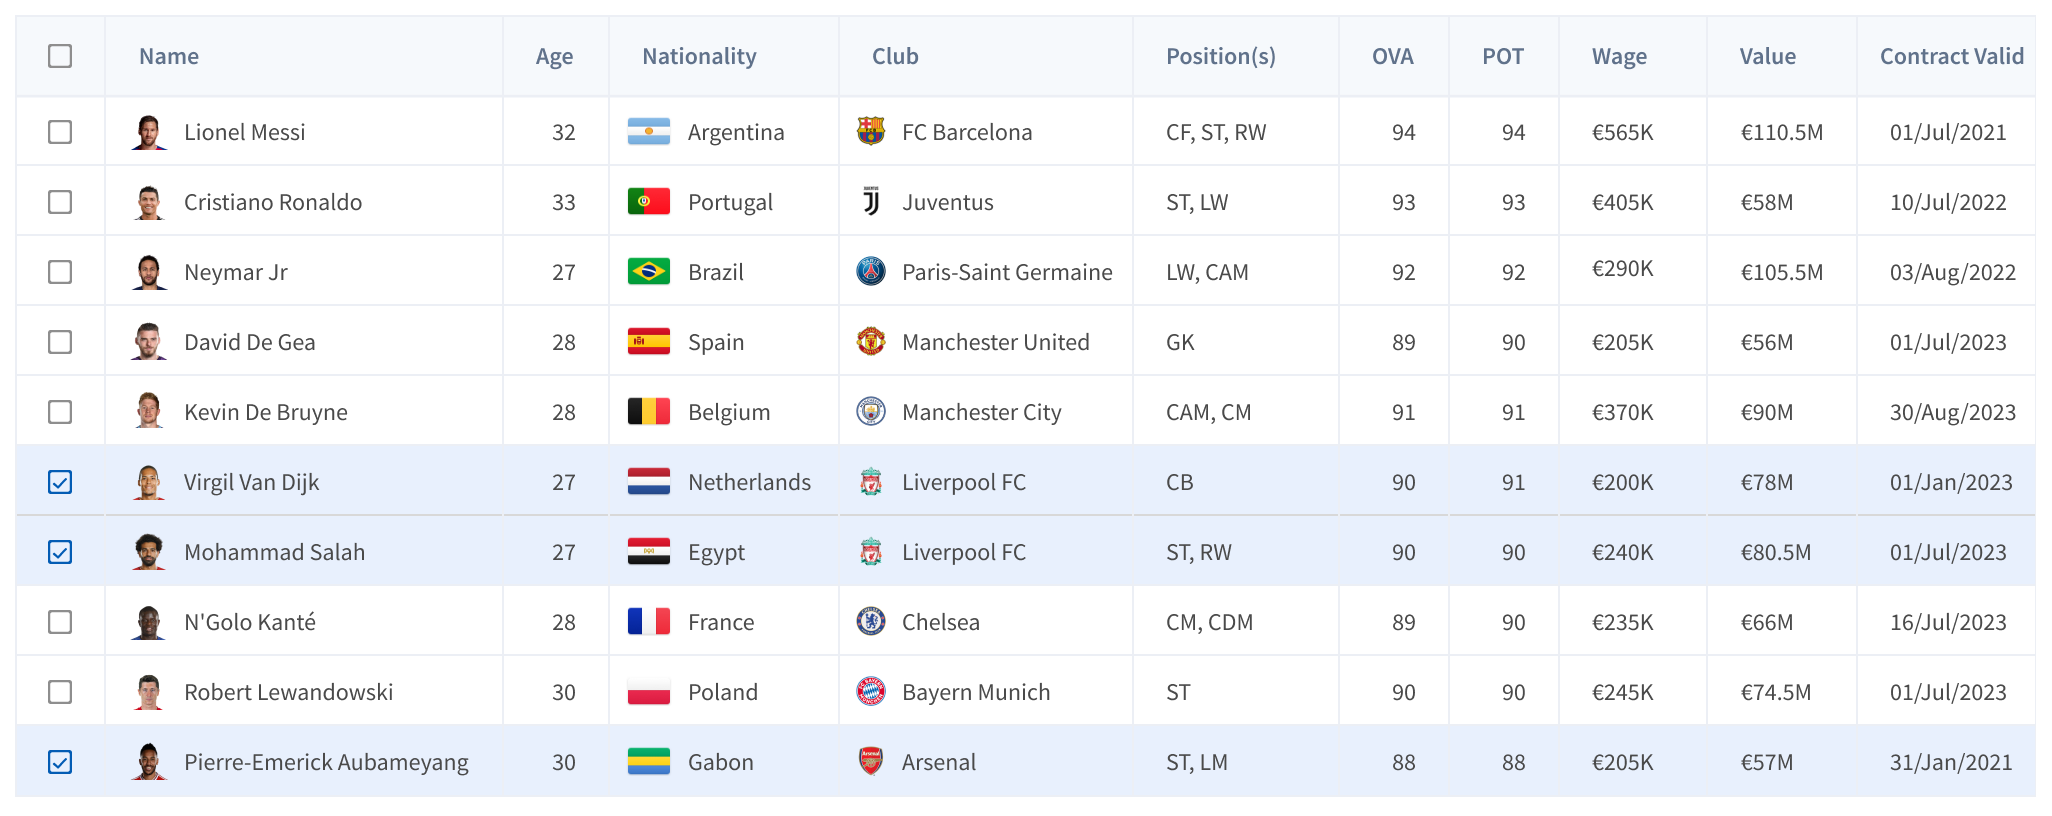
Row Selection in Grid
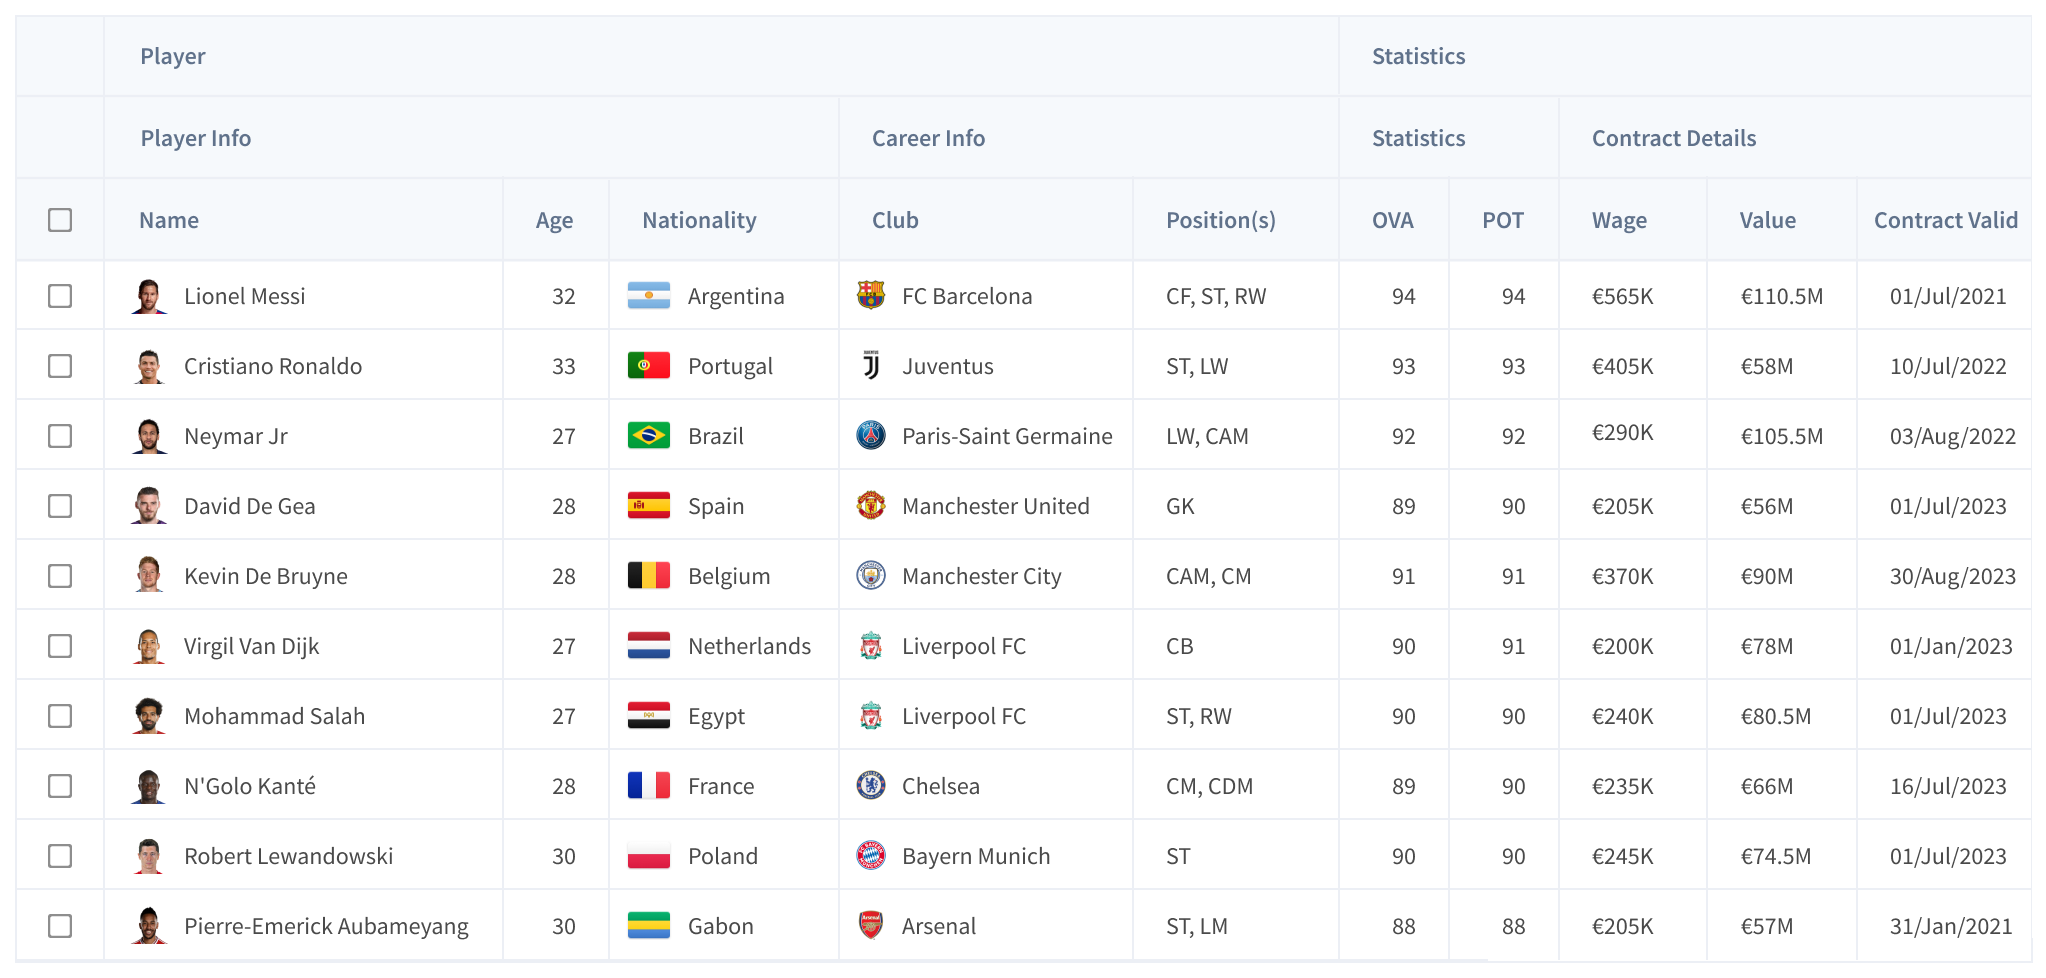
Column Grouping/Nested Columns in Grid
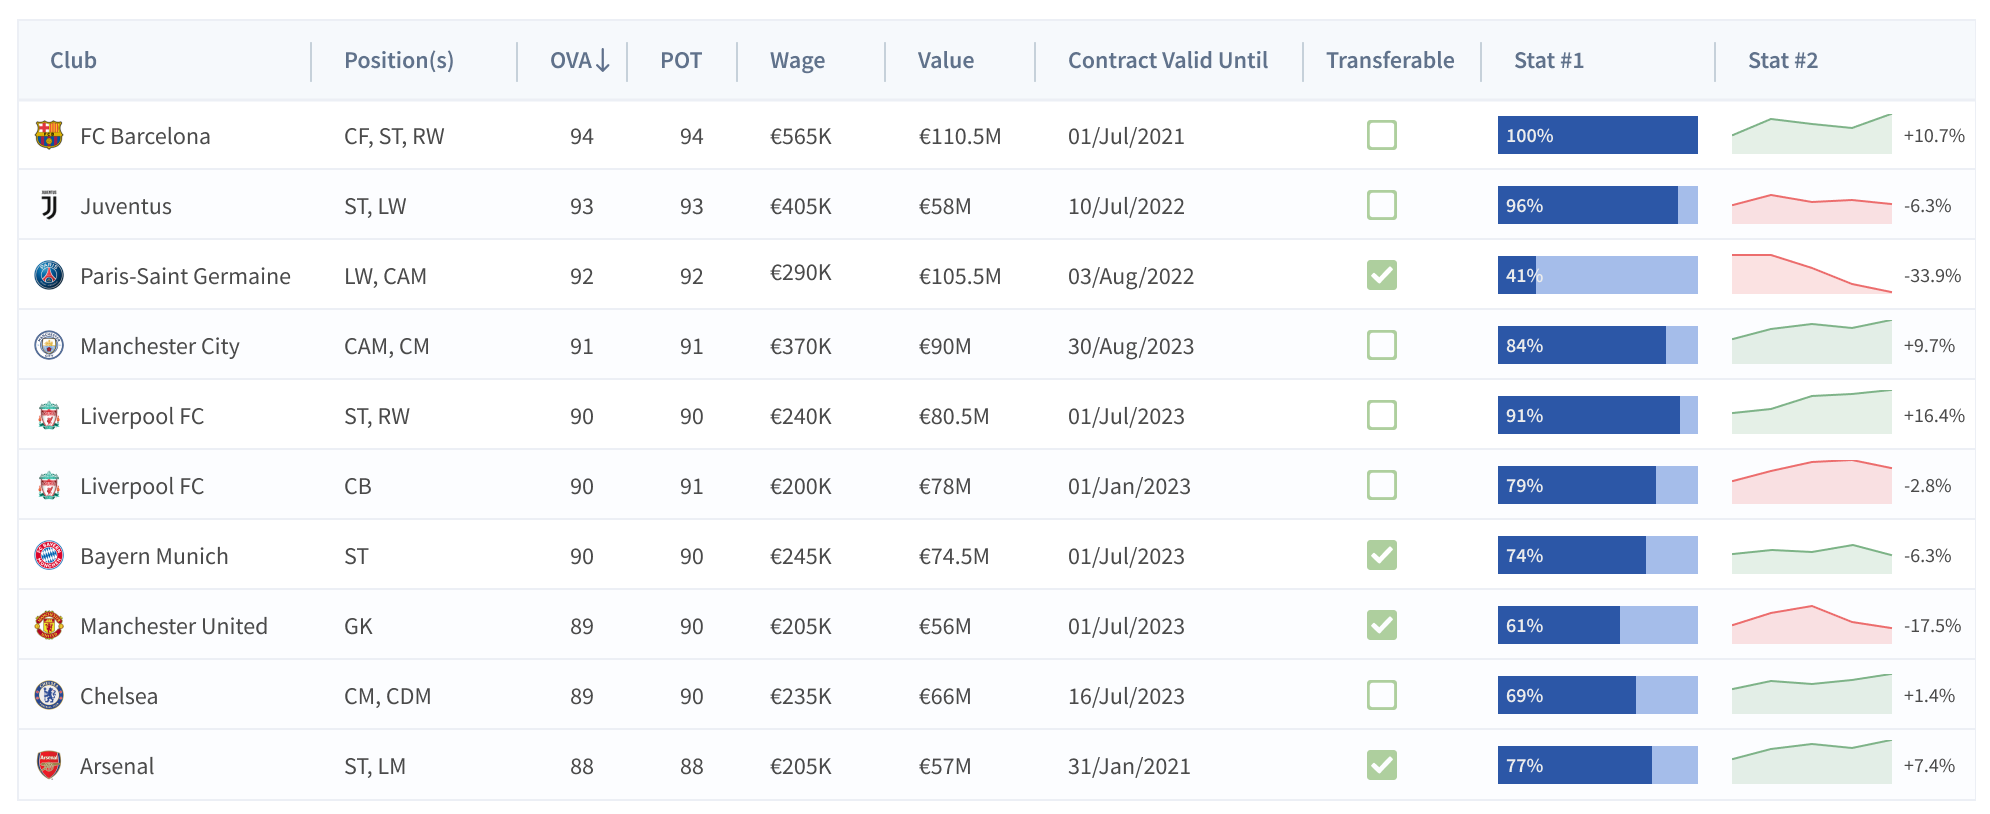
Real-time Data update in Grid
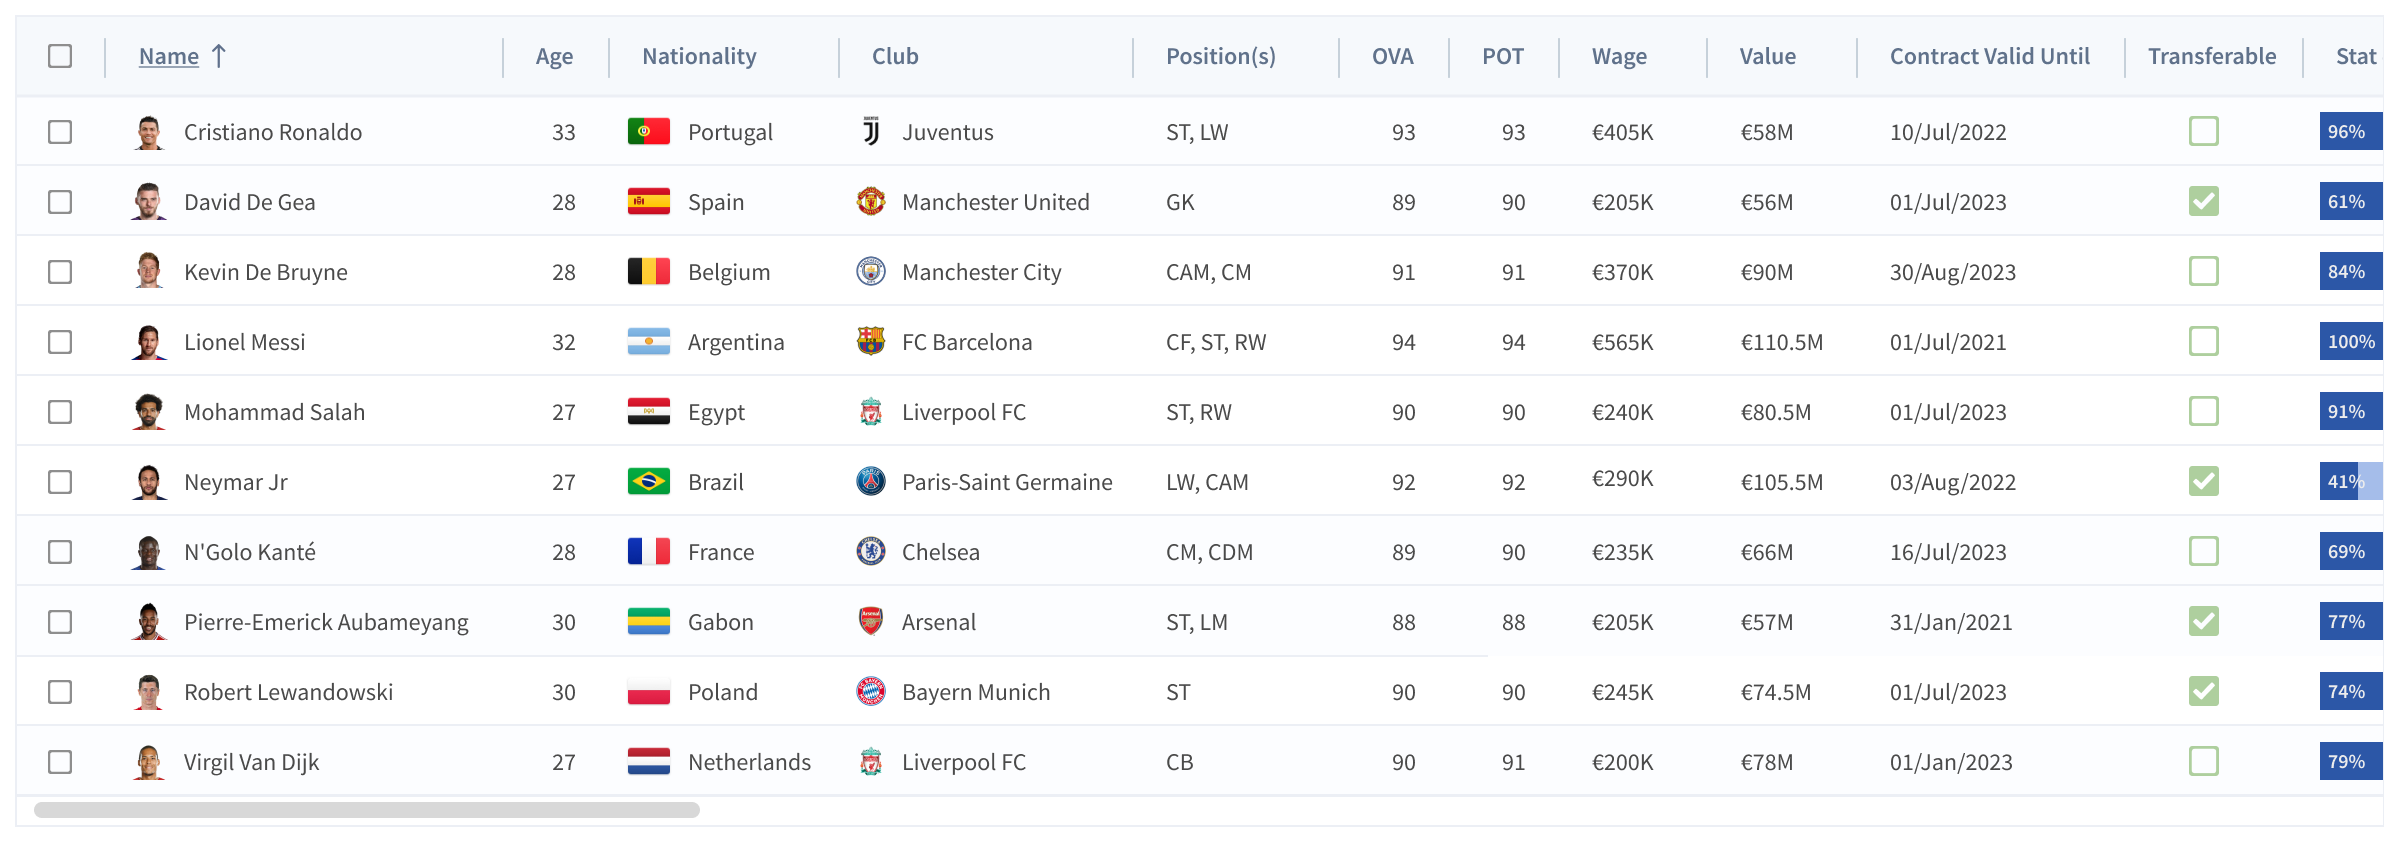
Row Sorting in Grid
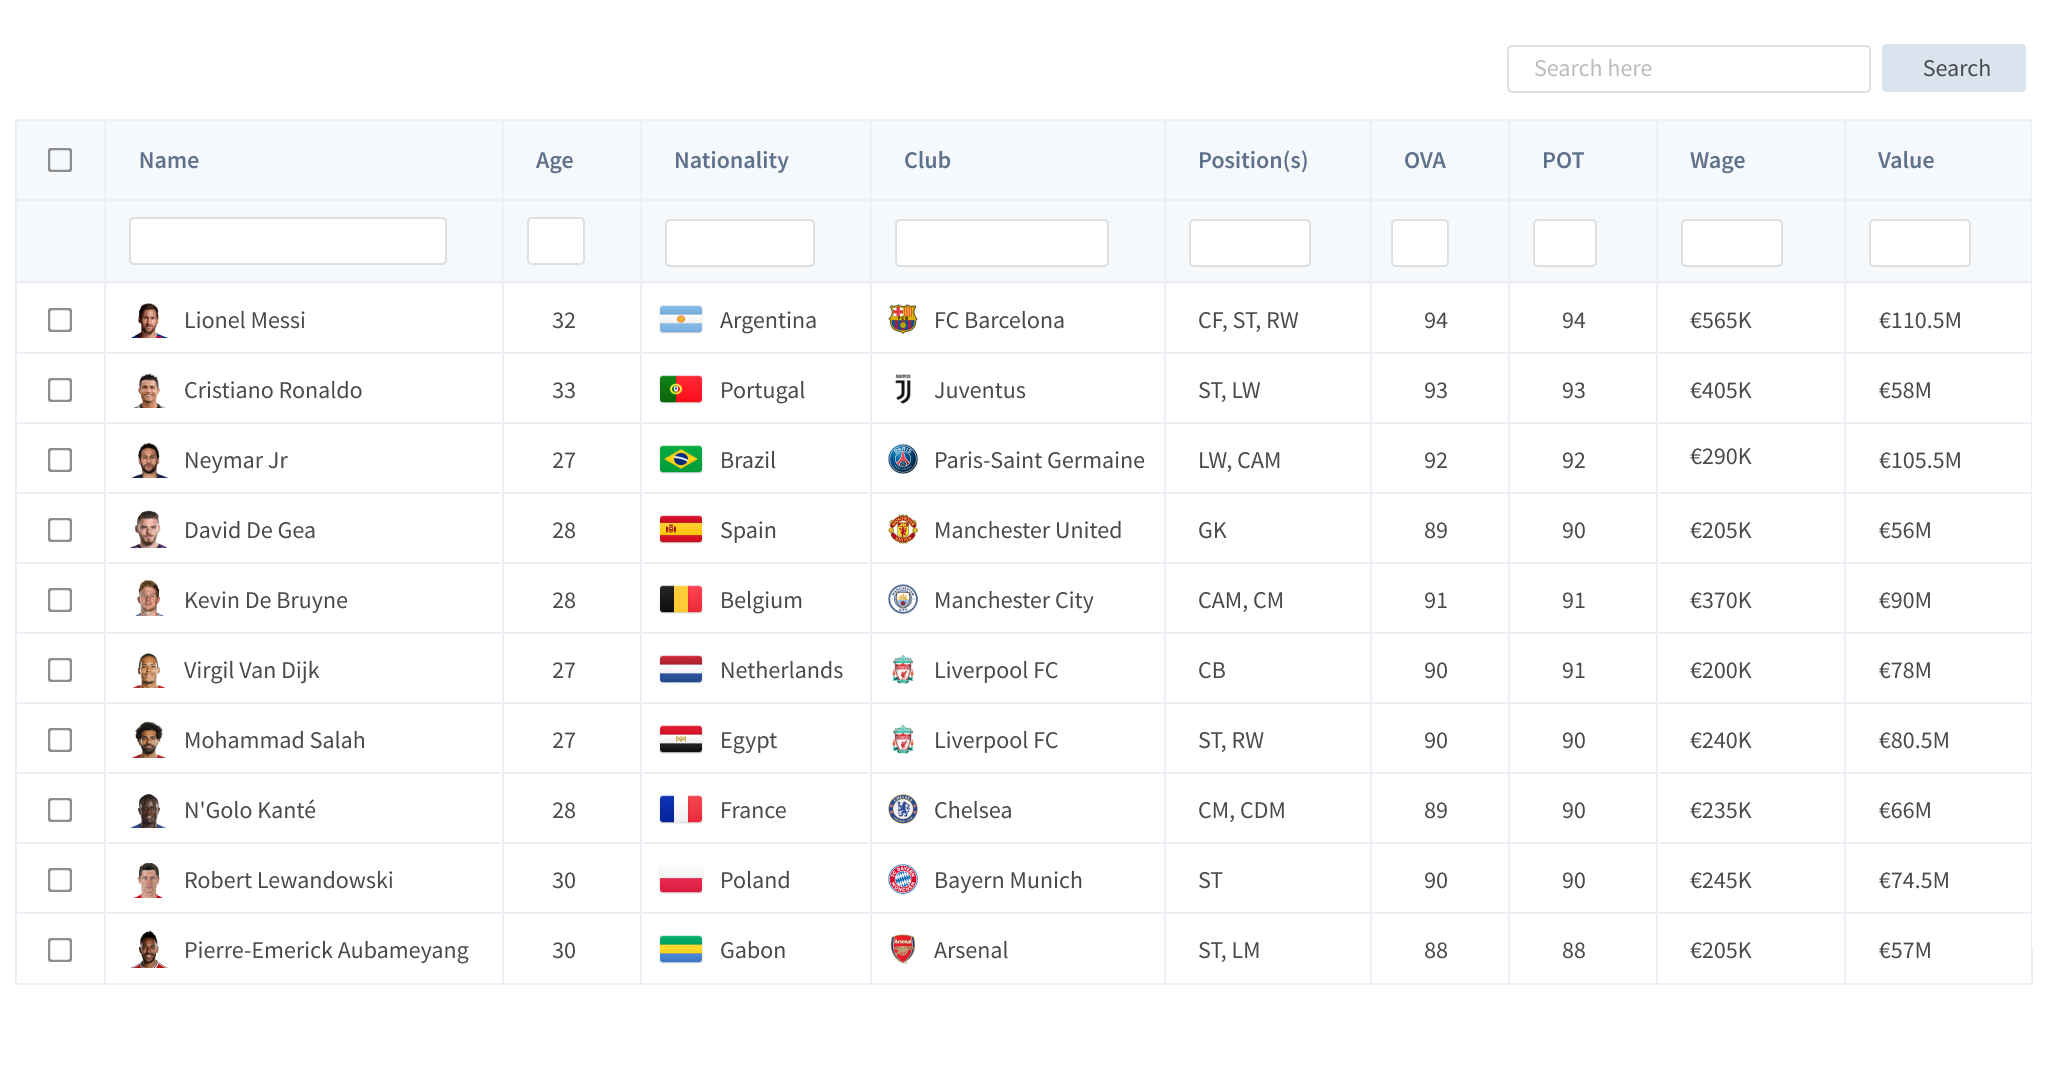
Search/Quick filter in Grid
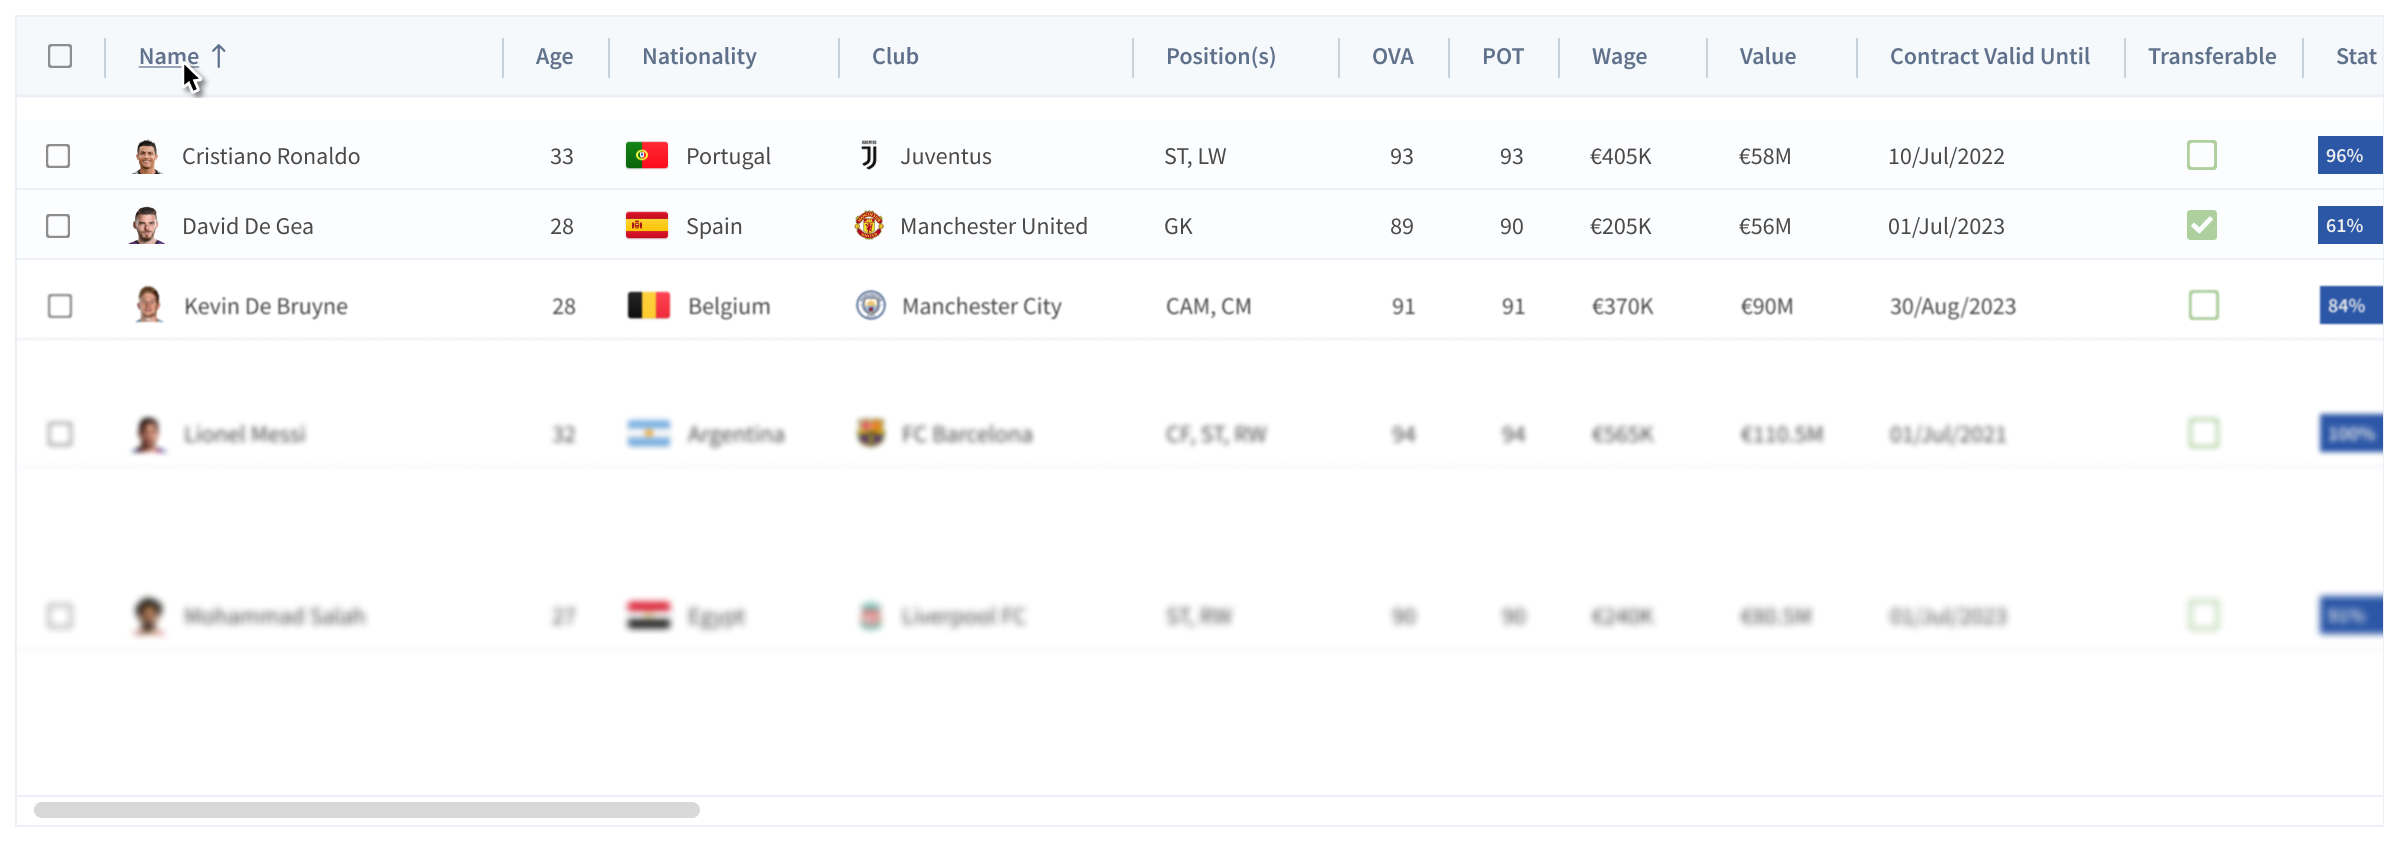
Row Animation upon Data Operation Interaction
Built for High-Performance Data Tables
FusionCharts Grids is a specialized, high-performance data table engine built for applications where users must work directly with large, structured datasets.


When Grids
Makes Sense
Grids is ideal for products and teams that require detailed, hands-on data exploration, including:
- Analytics platforms where users drill down from charts into raw data
- Financial and operational systems with large tabular datasets
- Admin and internal tools that require sorting, filtering, and bulk data interaction
- Enterprise reporting applications where accuracy and data density are critical
How Grids Complements the Core Visualization Suite
Grids is designed to work seamlessly alongside FusionCharts, Maps, and Gantt extending the platform from visual insight into detailed data interaction.
- Use charts to identify trends and patterns
- Use maps to understand geographic distribution
- Use Gantt charts to visualize timelines and dependencies
- Use grids to explore, validate, and act on the underlying data
Together, they create a complete analytics experience, from high-level insight to row-level detail.
Turn numbers into narratives your users actually understand
FusionCharts Grids is included as part of the FusionCharts charting suite, alongside Maps and Gantt visualizations.