Interactive Map Visualization for Location-Based Insights
Transform location data into clear, actionable intelligence with a powerful, API-driven mapping library built for modern applications

Population Growth: World-Wide

WeWork Office Locations

Shipping Routes in US

Average temperature of US States
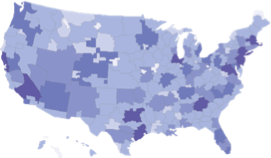
Television exposure by DMA in US

Fertility rates in Europe

Greenhouse gas emissions
Built for Data-Driven
Geographic Visualization
FusionCharts Maps is designed for applications where location matters. FusionCharts Maps is a high-performance data visualization solution for building interactive, data-driven maps inside web and enterprise applications. Designed for developers and product teams, it enables teams to convert geographic data into interactive, meaningful visualizations that help users quickly understand regional trends, performance differences, and spatial relationships.
Free TrialDesigned for Developers, Trusted by Enterprises
FusionCharts Maps is built to integrate seamlessly into modern application stacks while meeting enterprise expectations for performance and stability.
- Framework-agnostic implementation
- Optimized rendering for large datasets
- Predictable behavior across browsers and devices
This makes it ideal for teams building analytics platforms, SaaS products, and internal enterprise tools where geodata insight is a core feature.
What You Can Build with FusionCharts Maps
FusionCharts Maps supports a wide range of real-world business and enterprise use cases, allowing teams to move beyond static maps and into interactive geospatial analysis.

Sales & Market
Performance Dashboards
Visualize revenue, pipeline, or conversion metrics across countries, states, or regions to identify high-performing and underperforming markets at a glance.
- Compare regional sales performance
- Track growth trends by geography
- Drill down from global to local views

Operational & Supply
Chain Monitoring
Monitor geographically distributed operations such as warehouses, delivery networks, or service regions using real-time or near-real-time data.
- Identify delays, bottlenecks, or regional risks
- Track operational KPIs by location
- Support faster, data-driven decisions

Customer &
Demographic Analysis
Map user distribution, adoption rates, or demographic attributes to understand where customers are located and how behavior varies by region.
- Customer density and segmentation maps
- Regional adoption and churn analysis
- Market penetration insights

Risk, Compliance &
Performance Reporting
Use maps to communicate complex regional data clearly in regulated or compliance-driven environments.
- Risk exposure by geography
- Regional compliance status
- Incident tracking and reporting
Turn numbers into narratives your users actually understand
FusionCharts Maps allow developers to plot metrics across countries, regions, states, and custom geographies with support for hover interactions, drill-downs, and dynamic color scales, making it easy to identify regional patterns, trends, and outliers within applications. FusionCharts Maps is included as part of the FusionCharts charting suite, alongside Charts and Gantt visualizations.