Reliable, High-Performance Time Series Charts for Developers
Our Time Series charting solutions are built for applications that visualize temporal data with precision and clarity. Whether you’re tracking trends, monitoring real-time streams or analyzing historical patterns, our Time Series charts give you the tools to create responsive, intuitive charts that handle time-based data at scale.

Powerful time navigator
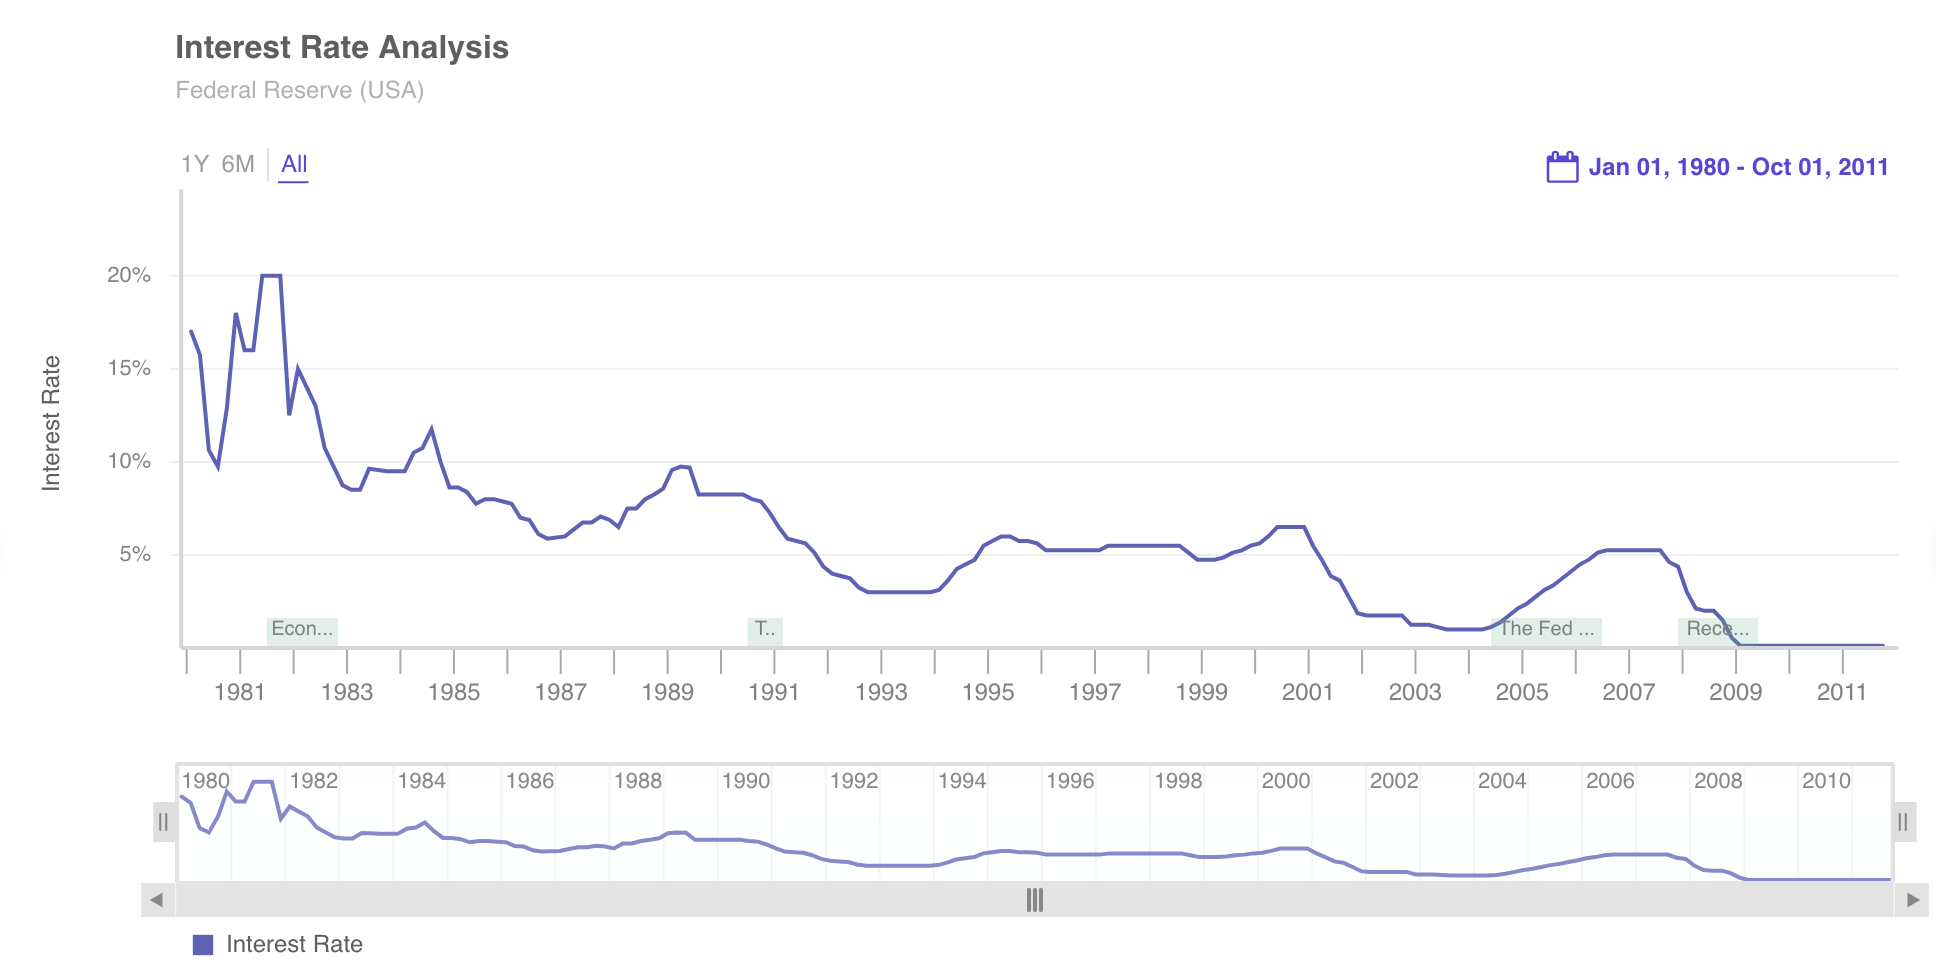
Date range selectors

Overlay of important events

Annotation of data

Auto scaling of time-axis

Multi-canvas tooltip

Plot Reference lines

Support for linear and log axis

Plotting of missing data
Designed for Time-Driven Insights
Time Series charts make it easy to render timelines, trends and real-time updates in contexts where data changes over time, from seconds to years. It supports automatic scaling, date/time parsing, zoom/pan interactivity and animated transitions that help users smoothly explore temporal datasets without custom logic or heavy configuration.
What You Can Build with
Time Charts
Our Time Series charts are ideal for any application that needs to make time-based data easier to explore and act on..

Real-time monitoring dashboards
Display live metrics such as system performance, traffic, sensor readings, or user activity with smooth updates.

Trend and history
analysis
Visualize patterns over time — daily, monthly, or yearly — enabling deeper analytical insight for forecasting or reporting.

Financial and operational
time series
Chart stock prices, revenue trends, resource utilization or KPI histories with accurate time scaling and granularity control.

Event-based
insights
Correlate events and metrics on timeline charts for debugging, auditing, or impact analysis.
Developer-First Time Series
Our Time Series Charts are designed to be predictable, flexible, and compatible with modern development practices:
Consistent JSON configuration
Define time axes, formats, and behaviors with structured config.
Automatic date parsing
Support for ISO, UNIX, and custom date/time formats.
Interactive zoom and scroll
Navigate large time ranges without manual state handling.
Real-time update support
Push new data points dynamically without re-rendering the entire chart.
Included in the FusionCharts license, Time Series Charts works seamlessly with Charts, Maps, and Gantt — all built on a unified API and configuration model.
Why Choose Time Series Charts
Time Series Charts helps development teams:
- Deliver better time-based analytics faster: avoid building custom time axis logic or managing temporal edge cases manually.
- Reduce technical debt: use a consistent, supported API that scales with product needs.
- Empower users: provide intuitive time navigation, real-time updates, and interactive exploration without custom UI components.
By combining ease of use with enterprise-grade reliability, Time Series charts become a core part of any data-intensive application where time matters.
Ready to Visualize Time Data with Precision?
Build interactive, high-performance time series charts with FusionCharts — fast to implement, easy to maintain, and powerful at scale.